
Fundamental analysis is a method used to evaluate a company’s intrinsic value by examining related economic, financial, and other qualitative and quantitative factors. Fundamental analysts study everything from the overall economy and industry conditions to the financial condition and management of companies. Ratios derived from financial statements play a crucial role in this analysis. Here’s how one might tackle this using software and programming resources:
Task 1: Introduction and Where to Get Company’s Reports
Introduction
Begin with an introduction to fundamental analysis, focusing on its importance in evaluating stocks for investment. Explain the concept of intrinsic value and how financial ratios help in assessing a company’s performance and financial health.
Where to Get Company’s Reports
Company reports can be obtained from:
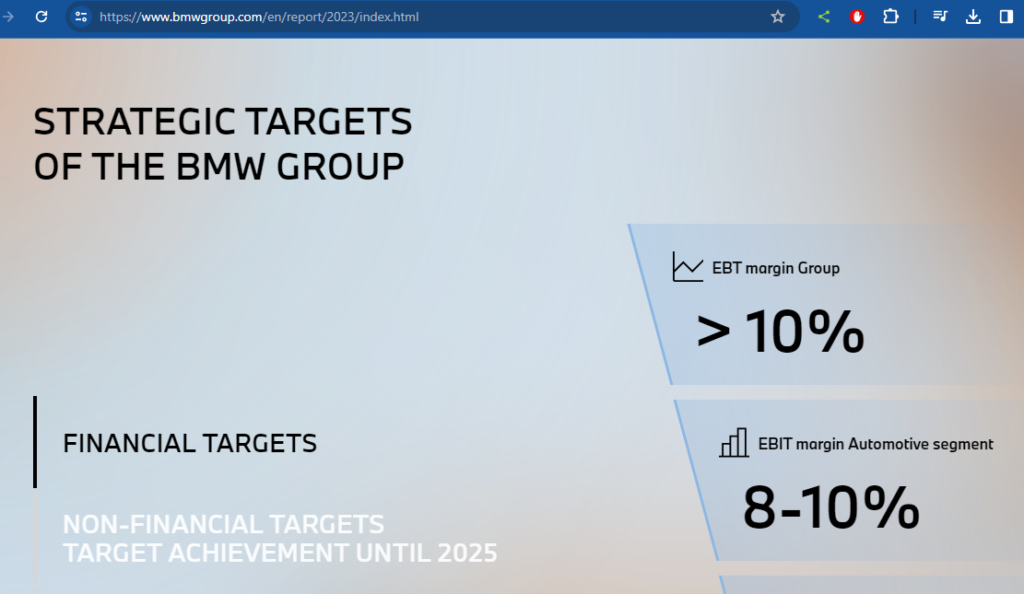
- Official Company Websites: Most companies publish their annual reports and financial statements on their websites.
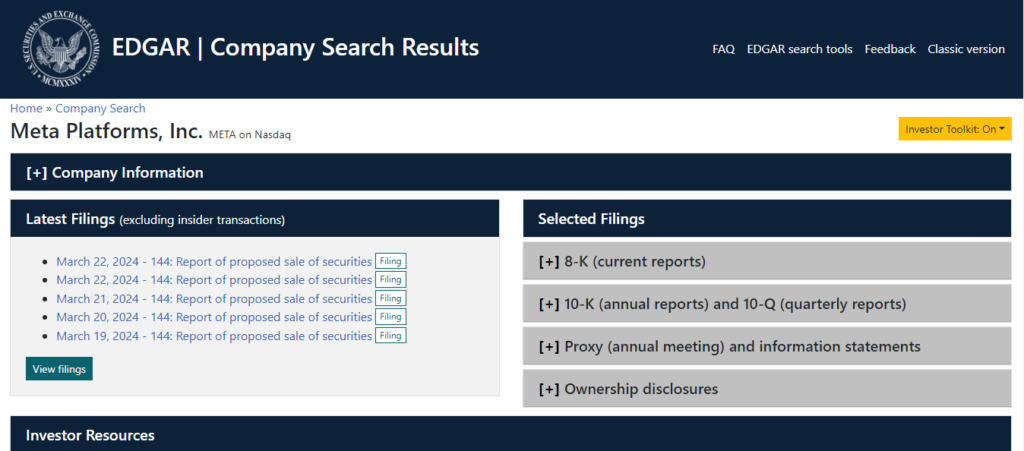
- Securities and Exchange Commission (SEC): In the U.S., the SEC’s EDGAR database provides a wealth of information.
- Financial News Websites: Websites like Bloomberg, Reuters, and Yahoo Finance offer financial data and reports.
- APIs and Financial Data Providers: Services like Alpha Vantage, Financial Modeling Prep, or Quandl provide APIs to access financial data programmatically.
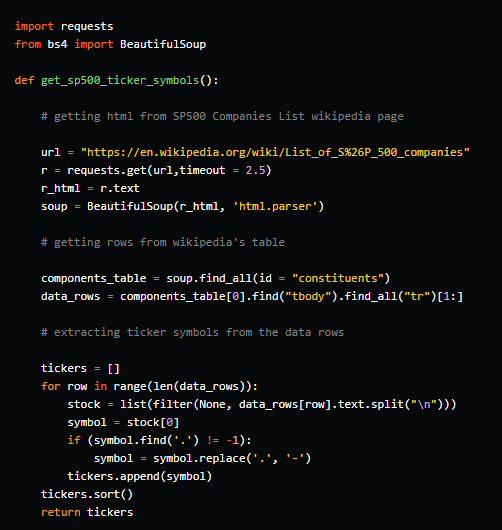
Programming tools like Python can be used to automate the retrieval of financial reports through APIs or web scraping (where legally permissible).
Task 2: Profitability Analysis
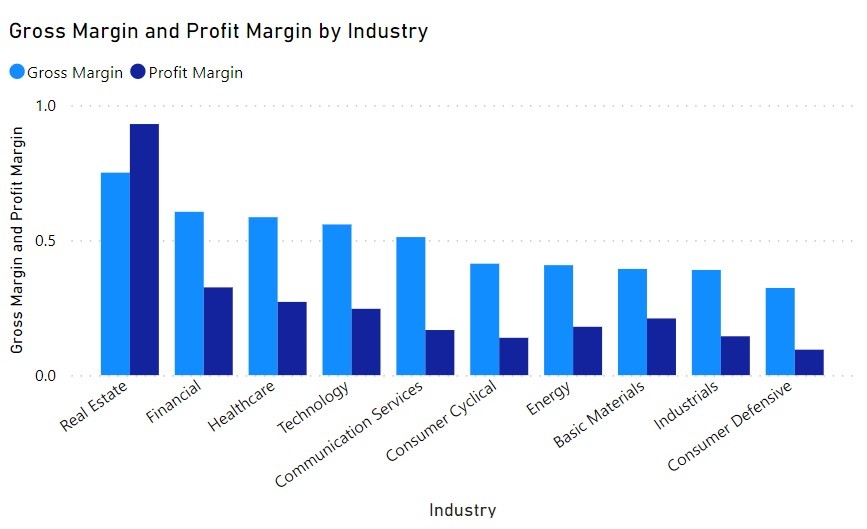
Profitability ratios measure a company’s ability to generate earnings relative to its revenue, assets, equity, etc. Key ratios include:
- Gross Profit Margin
- Operating Profit Margin
- Net Profit Margin
- Return on Assets (ROA)
- Return on Equity (ROE)
You can use Python libraries such as Pandas for data manipulation and analysis. Calculating these ratios involves obtaining values from the income statement and balance sheet, such as gross profit, operating income, net income, total assets, and shareholders’ equity.
Task 3: Liquidity Analysis
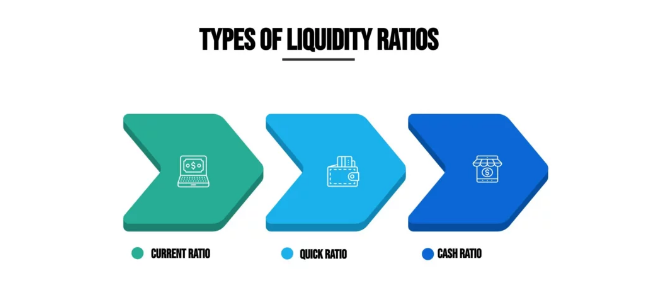
Liquidity ratios assess a company’s ability to pay off its short-term obligations. Important ratios include:
- Current Ratio
- Quick Ratio (Acid-Test Ratio)
- Cash Ratio
These ratios require data from the balance sheet, particularly current assets and current liabilities. Financial data APIs or direct financial statements can provide this data, with Pandas being useful for analysis.
Task 4: Activity Analysis
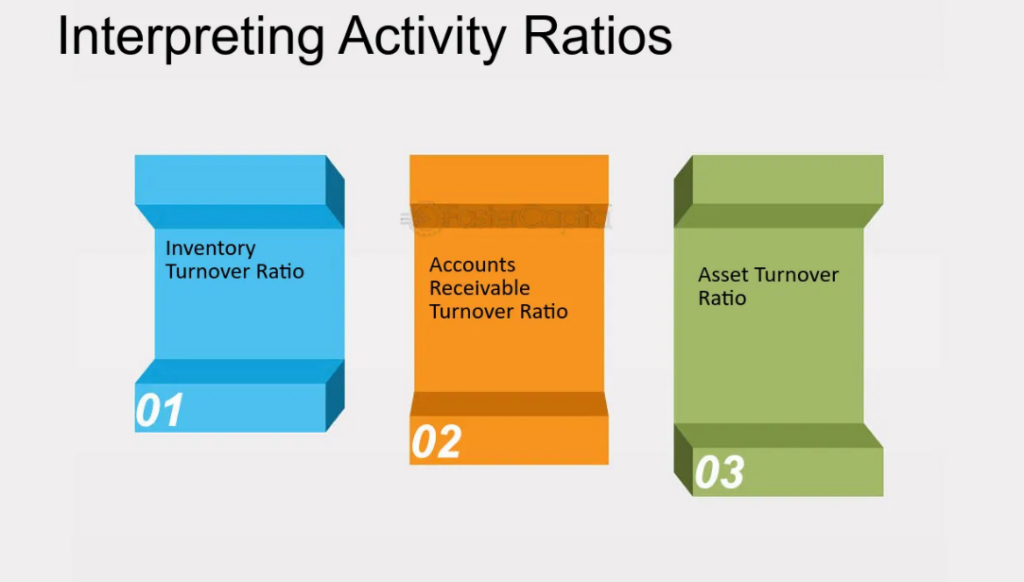
Activity ratios (or efficiency ratios) evaluate how well a company uses its assets. Key ratios include:
- Inventory Turnover
- Accounts Receivable Turnover
- Asset Turnover
These analyses require details from both the income statement and balance sheet. Programming languages like Python, with libraries for financial analysis, can automate these calculations.
Task 5: Solvency Analysis
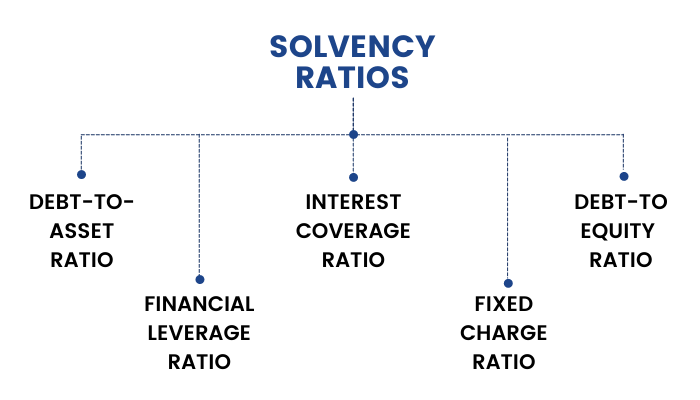
Solvency ratios determine a company’s ability to sustain operations indefinitely by examining its leverage and debt levels. Important ratios are:
- Debt to Equity Ratio
- Interest Coverage Ratio
These require long-term debt and interest expense data, among others. Automating these calculations can significantly improve efficiency.
Task 6: Discussing the Results
After calculating these ratios, the next step is to interpret them. This involves:
- Comparing to Industry Averages: Understanding how the company stacks up against its peers.
- Trend Analysis: Looking at how these ratios have changed over time to identify trends.
- Contextual Analysis: Considering the broader economic and industry-specific context.
Software tools can aid in visualizing this data, using libraries like Matplotlib or Seaborn for Python. This helps in making informed investment decisions.

In summary, fundamental analysis using ratios involves a detailed examination of financial statements to assess a company’s performance. Software and programming resources, particularly Python and its libraries, can automate data retrieval and calculation processes, making the analysis more efficient and comprehensive.
 Save as PDF
Acerca del autor


