In a marketplace where large tech companies are setting the pace, as a small to medium-sized business (SMB) you might feel like you’re playing catch-up.
But your ace in the hole is knowing your customer and market nuances intimately. Your power resides in your unique data streams, and the game is won when you tech and deploy this data with accuracy.
Generative Business Intelligence (BI) is a new type of business intelligence that combines generative artificial intelligence and augmented analytics. Generative BI uses AI to transform data into resources for proactive and predictive insights.
Generative BI: a New Era of Business Intelligence
Michael Rumiantsau
Previously in Unlocking Value: Fundamental Analysis with Financial Ratios we saw that Fundamental Analysis is a method used to evaluate a company’s intrinsic value by examining related economic, financial, and other qualitative and quantitative factors.
I am currently working on a project development that aims to develop financial analysis solutions with Generative BI on financial statements, Financial AI Sights. When we talk about financial data, like what you might look for on sites like Investing.com, we’re generally referring to information that comes from financial markets and companies.
Let’s look at the bases for this process of data capture, processing and visualization.
Data capture, processing and visualization.
Where does the data come from?
Financial Markets: Data may include stock prices, stock indices, currency exchange rates, commodity prices, and more. This data is generated from transactions and quotes on stock exchanges and financial markets around the world.
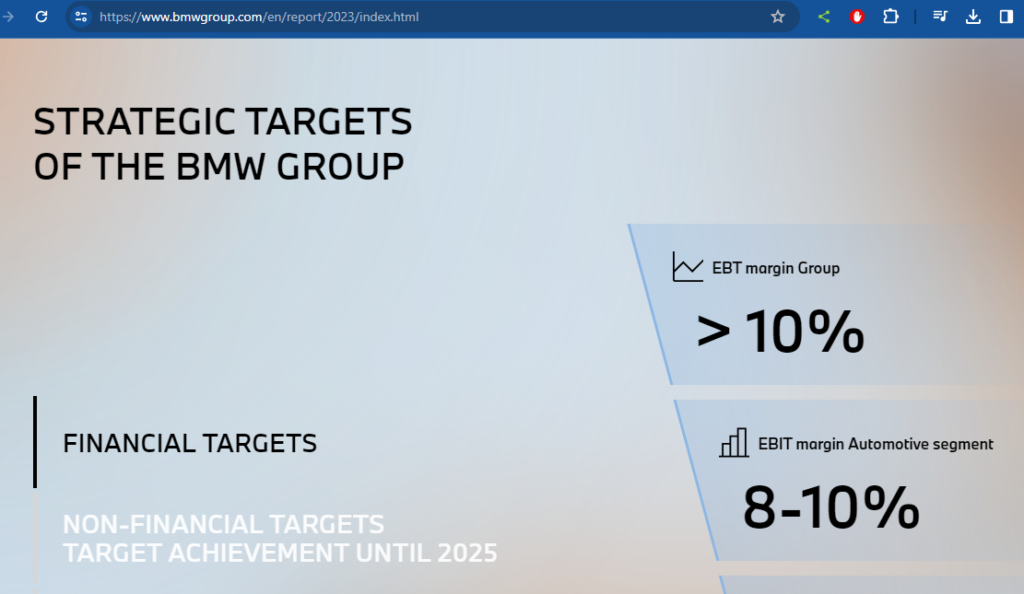
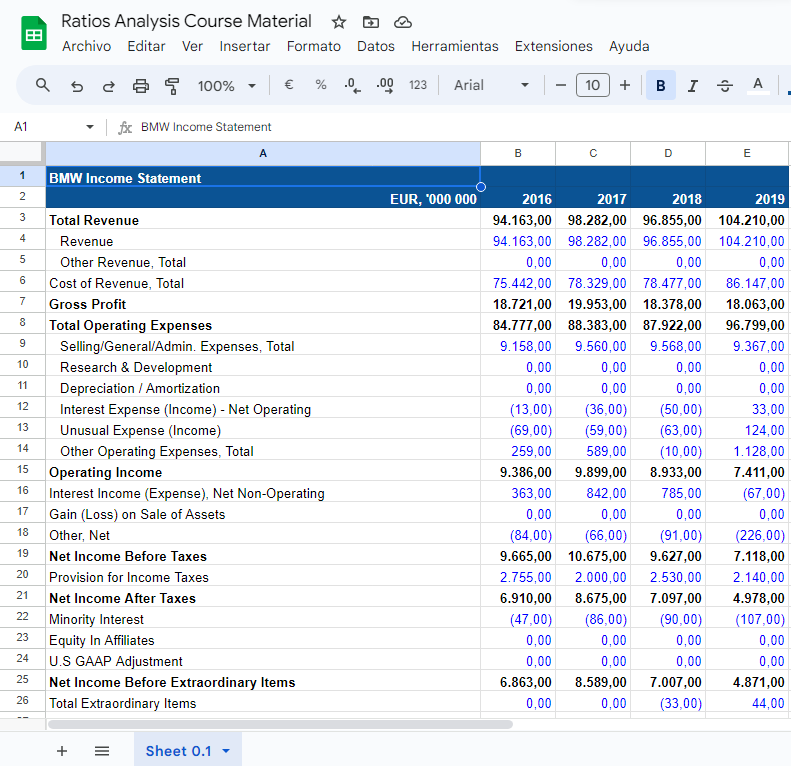
Companies: Public companies provide financial reports (such as balance sheets, income statements, and cash flows) that are a primary source of data for analyzing their financial health. These reports are published periodically in accordance with the regulatory requirements of the country in which they are registered. Fetch from BMW FE: https://www.investing.com/equities/bay-mot-werke-financial-summary and VW FE: https://www.investing.com/equities/volkswagen-ag-financial-summary
Government Agencies and International Organizations: Economic information such as interest rates, unemployment rates, GDP, and other economic indicators are provided by entities such as the Central Bank, the Department of Statistics, the IMF, and the World Bank.

Analysis and Projections: Financial analysts and research firms also generate data in the form of buy/sell recommendations, stock performance projections, and market analysis.
What did the data measure?
Financial and Economic Performance: The data can measure the financial performance of companies, the health of financial markets, and the economic situation of countries or regions.
Market Value: Stock and commodity price data reflect the market value perceived by investors.
Market Activity: Trading volumes and market activity indicate the level of interest and activity in certain assets or markets.
Financial performance is a subjective measure of how well a firm can use assets from its primary mode of business and generate revenues. The term is also used as a general measure of a firm’s overall financial health over a given period.
Investopedia
What was the data used for?
Investment Decision Making: Investors use data to make informed decisions about buying, selling or holding financial assets.
Economic Analysis: Economists and analysts use economic data to assess the economic health of countries or regions, forecast economic trends, and advise on economic policies.
Corporate Management: Companies analyze financial and market data for business strategies, financial planning, and evaluating performance against competitors.
Academic Research: Researchers and academics study financial and economic data to better understand markets, the economy, and consumer behavior.
Financial data is crucial in a wide range of contexts and for diverse stakeholders, including investors, analysts, companies, and policymakers.
Artificial Intelligence and Technology
Technology and computer programs play a crucial role in the acquisition, processing and visualization of financial and economic data, significantly facilitating managerial decision-making. Modern technology tools and artificial intelligence (AI) have revolutionized the way organizations manage and analyze large volumes of data.
Here I explain how:
Data acquisition
Financial Data APIs: Many financial platforms offer APIs that allow access to real-time or historical market data programmatically. This simplifies the integration of external data into internal systems.
Web Scraping: Scraping tools allow you to extract data from websites that do not offer APIs, although legal and technical limitations must always be taken into account.
Specialized Software: There are programs designed for the acquisition and management of financial data, such as Bloomberg Terminal, that provide access to a wide range of market data and analysis.
Using stock market APIs, developers can build financial applications and services that can access this data and integrate it with their own applications. This may include, for example, the development of financial analysis tools, trading platforms, portfolio trackers, or stock market games.
Bhttps://www.bavest.co/en/post/stock-market-api-what-you-need-to-know-about-financial-data-apis#:~:text=Stock%20exchange%20APIs%20are%20programming,and%20other%20relevant%20financial%20data.avest
Data processing
Databases and Cloud Storage: Technologies such as SQL and NoSQL databases, along with cloud storage solutions, allow large sets of data to be efficiently managed.
Data Cleaning and Preparation: Data preparation tools (as Power BI or Tableau) automate the cleaning and organization of data, preparing it for analysis.
High Performance Computing and Big Data: Technologies such as Hadoop and Spark facilitate parallel processing of large volumes of data, crucial for big data analysis.
Data Visualization
Visualization Tools: Software such as Tableau, Power BI and Qlik Sense allow users to create interactive visualizations of complex data, making it easier to understand and present insights.
Interactive Dashboards: These tools allow the creation of dynamic dashboards that display key metrics and trends in real time, essential for management decision making.
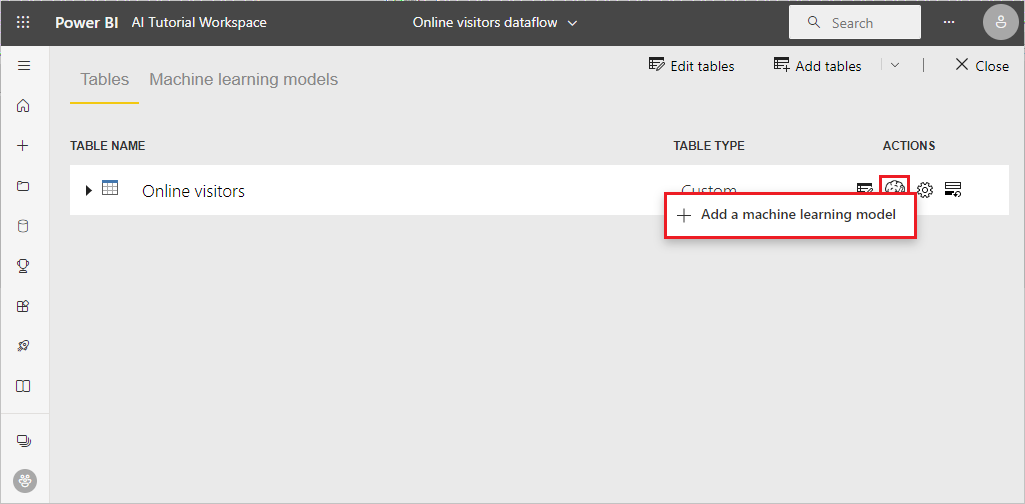
Place of AI in the Process
Machine Learning for Predictive Analytics: Machine learning models can analyze patterns in historical data to make projections about financial performance, identify investment opportunities, and forecast market trends.
Natural Language Processing (NLP): AI can analyze financial news, company reports, and social media posts to gain insights into market perception and possible price movements. As example, FinanceGPT is a web app that combines the power of generative AI with financial data, charts, and expert knowledge to empower your financial decision-making.
Robotic Process Automation (RPA): RPA uses bots to automate repetitive tasks related to data management, such as data entry and report generation, freeing up time for higher-value analysis.
AI-Based Decision Systems: By integrating AI models into decision systems, companies can automate the evaluation of investment options and risk management, based on a comprehensive analysis of available data.
The integration of these technologies allows companies to not only manage the increasing complexity and volume of financial data but also efficiently extract valuable insights, thus supporting informed and strategic decision making in an increasingly competitive business environment.